
Hanna Sliashynskaya PhD
Welcome to my Portfolio Page! I am Hanna Sliashynskaya, an analyst and linguist with a passion for data, languages and solving real-world puzzles with smart analyses.
About me
- international and multilingual professional
- data analyst and linguist
- passionate about using data to drive business decisions
- excited to start new projects and learn new technologies
- I am there to help transform raw data into real business impact
- eager to ask questions, research new topics and collect relevant data
Why analyse data?
Having access to large amounts of information, it is smart to use it to inform a wide range of decisions - from personal budgeting for individuals to risk management for businesses.Across all sectors, data analysis helps transform information into insights which can enable smarter decisions, increase efficiency and reduce costs for businesses.
For businesses
For NGOs and civic society organisations
For individuals
Why focus on language?
Numbers are not always as telling as we expect.
Feedback analysis answers the "why" questions: when subscribers leave or sales drop, written feedback from them can help you revert the situation.
Open-ended questions give exactly that — and collecting large numbers of responses allows gaining in-depth insights that are statistically significant.
Computational linguistic analyses uncover those in-depth looks into your audience's opinions and evaluate their weight
Clear recommendations for action are derived from such analyses and enable you to progress
Projects
Here are some of my projects:- LingvoViz - Map of languages of the world
- Railway Delay Analysis
- Social Buzz Content Performance Analysis
- Cyclistic User Behavior Analysis
Get in touch
Have I woken your interest? Feel free to reach out:
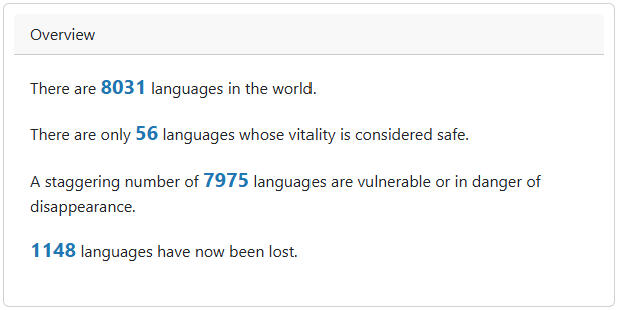
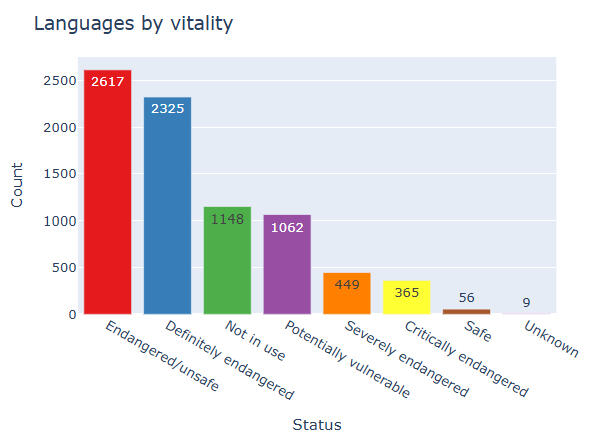
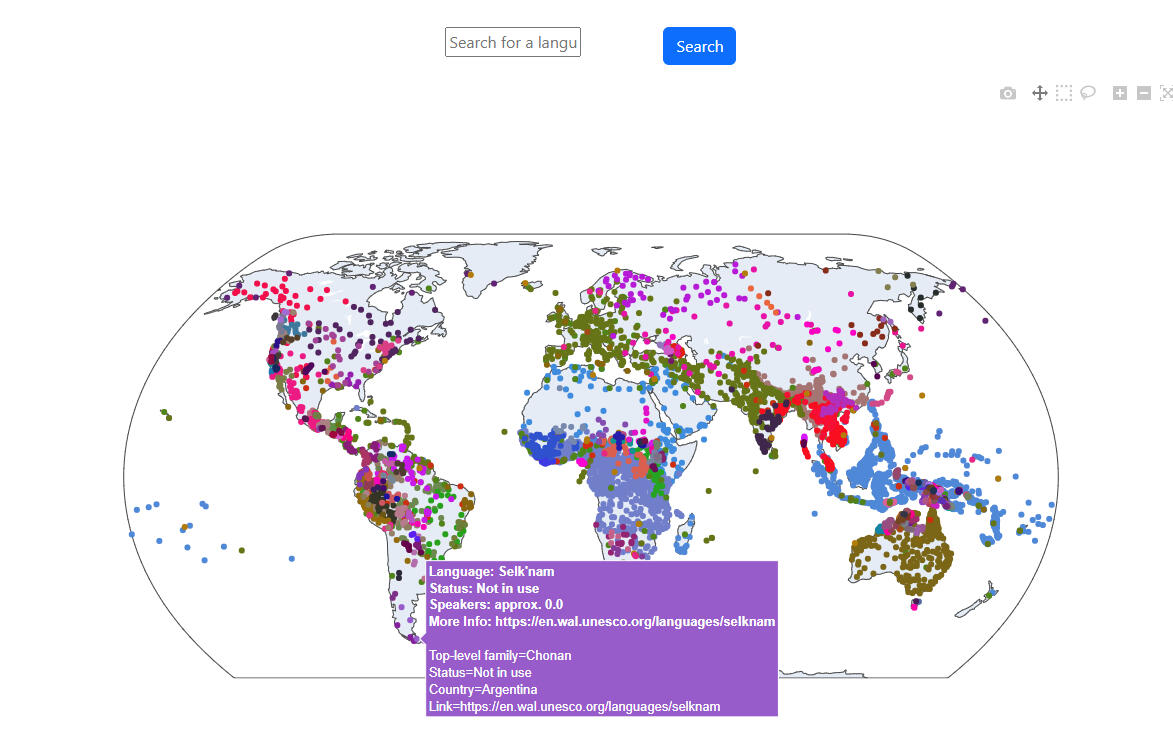
LingvoViz
Map of World Languages and a Dashboard on Linguistic Diversity
As a linguistics student, I often missed a go-to place where I could look at the world map and see how many languages are spoken in different parts of the world or to locate a language on the map.This inspired the dashboard that I created using data from UNESCO World Atlas of Languages and Glottolog.The purpose was to show language diversity of the world and provide information on language vitality, approximate numbers of speakers and distribution of language families.See the dashboard on Render.
Project steps
Webscraping (requests, BeautifulSoup, selenium) of 2 websites to create a rich dataset
data cleaning and merging (numpy, pandas)
visualisations (pandas, plotly)
dashboard (dash)
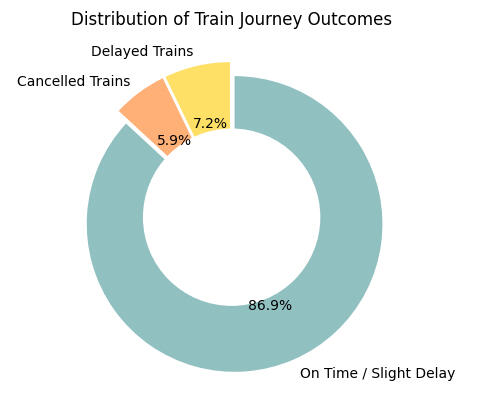
Railway Delay Analysis
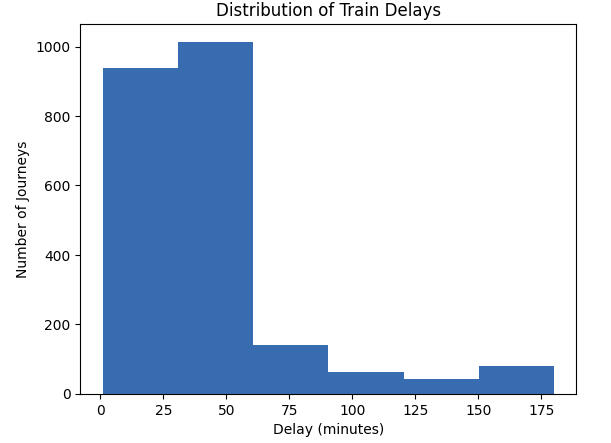
As a frequent train rider, I was always interested in train delay data and ways in which the delays can be targeted.I took these mock train ticket data for the National UK Rail from Maven Analytics and focused on delayed rides and potential ways to improve punctuality of trains.
data exploration, cleaning and transformation
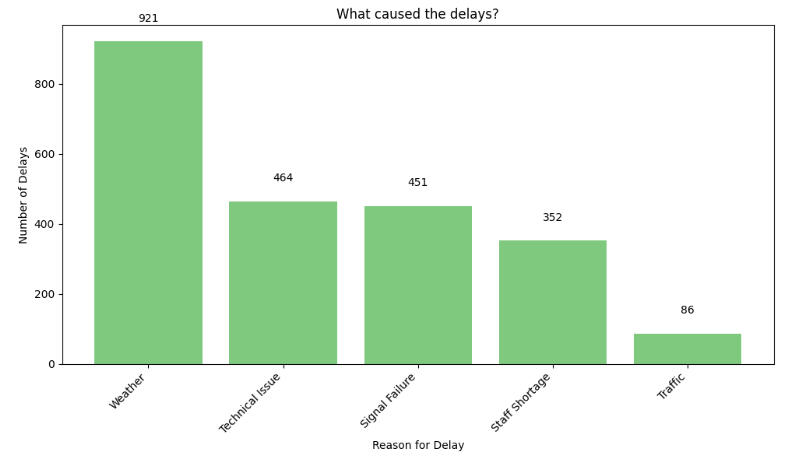
analysis(the share of delayed rides, common reasons for delay, the most affected routes, delays by time of the day, weekday, refunds stats)
visualisations
Recommendations
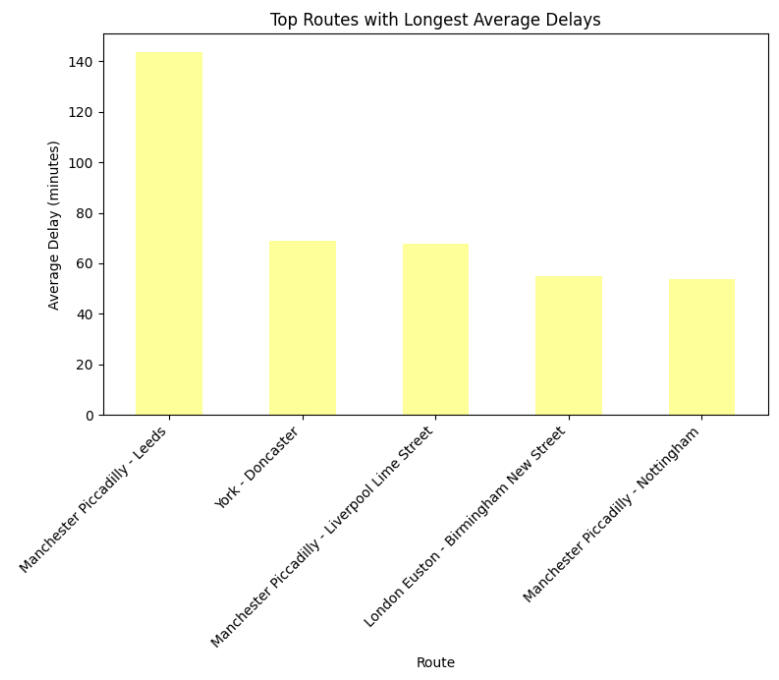
- Prioritise tackling the delays on the top 3 routes most affected by delays (route London Euston - Birmingham New Street is no. 4 in delays, but is also 2nd most popular route in the country);
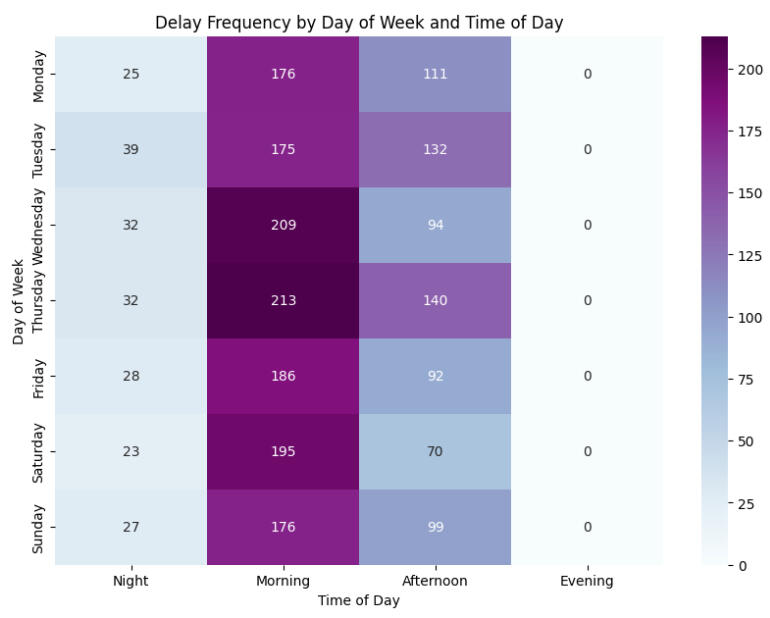
- Prioritise tackling delays on Wednesday a Thursday mornings as this is when delays are most frequent;
- the longest delays happen on Fridays, Saturdays, and Sundays but these do not lead to refund requests;
- technical issues and signal failures are the most frequent reasons for delays that can be tackled by improving the infrastructure and making the infrastructure more weather-proof.Check out the full project code on GitHub.
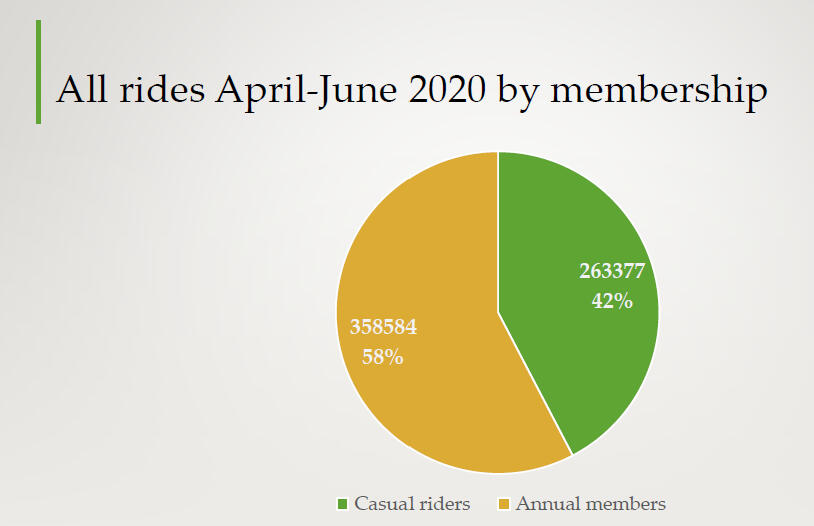
Cyclistic Bike Sharing User Preferences Analysis
I analysed all rides over a six-month period to gain insights into annual members and casual riders preferences and suggest conversion strategies for Cyclistic (a fictional bike-sharing company).I used BigQuery to analyse the data which I later visualised in Looker Studio.
data cleaning and transformation
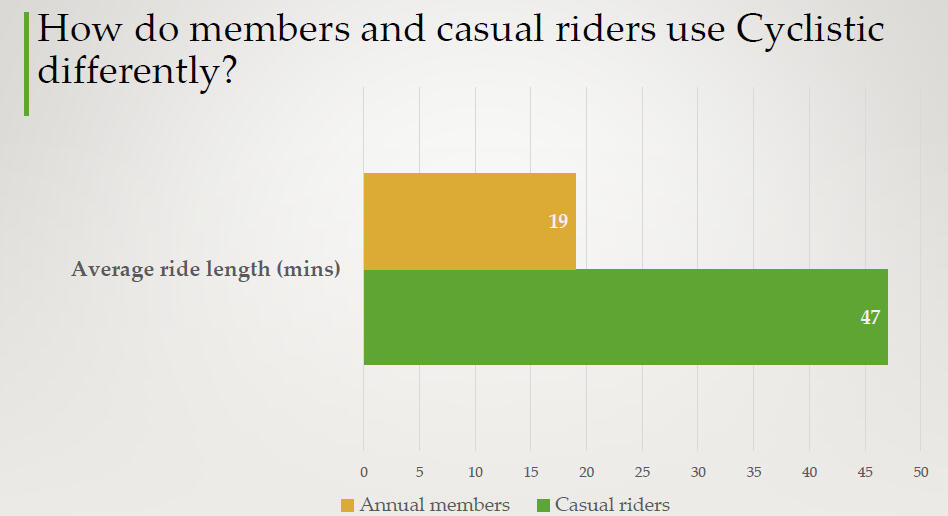
descriptive statistics (no. rides, max & min ride length, avg. and median ride length across groups)
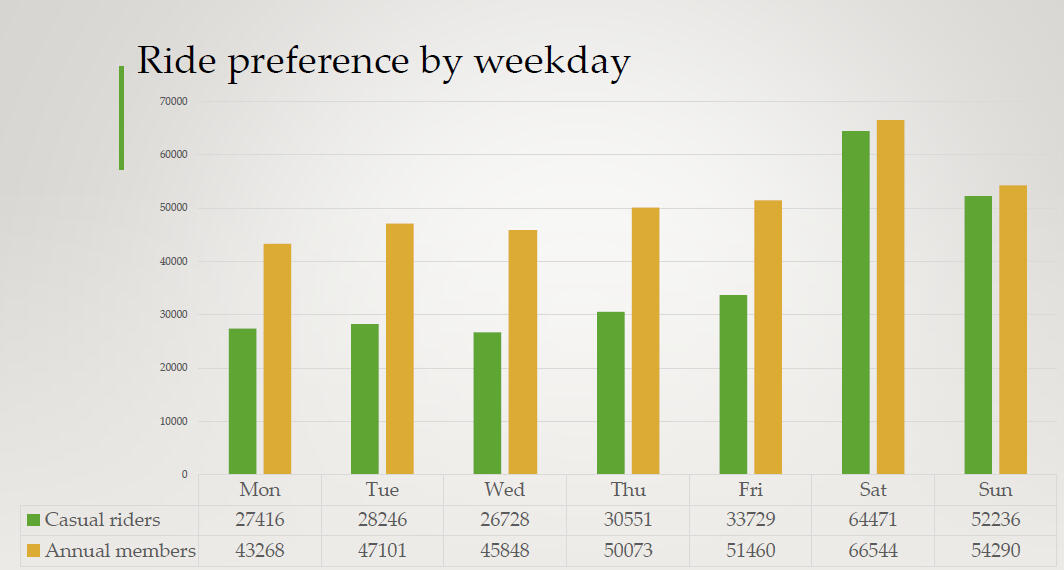
in-depth analysis of preferences across the two user groups (weekday vs. weekend analysis)
visualisations
Recommended conversion strategies and further analysis
- offer limited-time discounts for annual memberships (e.g a limited time promotion campaign for casual riders to send out on a weekend);
- offer guaranteed longer ride duration in high season and on weekends for annual members;
- survey casual riders to gain in-depth insights in their riding preferences.
Social Buzz Content Performance Analysis
Social Buzz is a new content platform that needed insights into most popular content categories
data cleaning and transformation
analysis
visualisations
I worked in Python with a Jupyter notebook.3 tables were provided for the analysis: content, reactions and reaction types.16 thematic categories and 4 types of content were identified after cleaning the data.Top 3 content categories by theme are:
- animals
- science
- healthy eating
You can find more details and full script here.